If you are interested in astronomy, you should have heard of the HR diagram. How to read the chart? What does each location in the diagram represent? Let’s find out in this article.
The HR Diagram
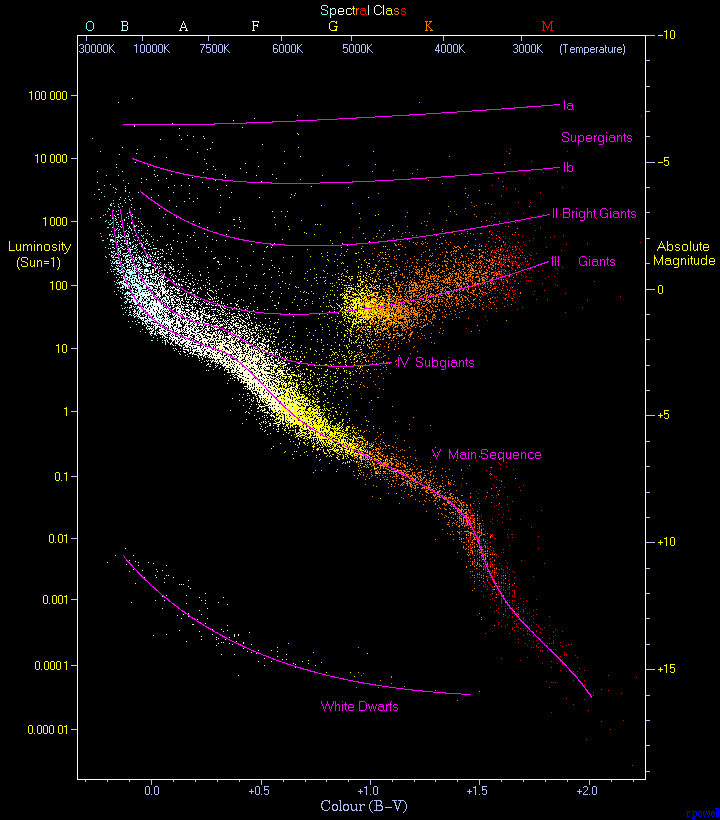
The HR diagram consists of two axes: The x-axis is related to temperature, while the y-axis is related to luminosity. The hottest and most luminous stars are in the upper-left corner, while the coolest and dimmest stars are in the lower-right corner. Keep in mind that the y-axis is not directly proportional and is a logarithmic scale.
The Spectral Types
As you can see, the stars are different in color. That’s because their surface temperatures are not the same. The hotter the star is, the shorter the wavelength of the light it emits. More specifically, the stars actually shine in a wide range of wavelengths, so the entire range shifts as well.
There are 7 main spectral types for stars: O, B, A, F, G, K, and M. The temperatures corresponding to each spectral type will be mentioned below.
- O: > 30000 K
- B: 10000 – 30000 K
- A: 7500 – 10000 K
- F: 6000 – 7500 K
- G: 5000 – 6000 K
- K: 3500 – 5000 K
- M: < 3500 K
Hotter stars tend to be closer to the upper-left corner than the lower-left corner. That’s because the hotter the star is, the more energy and light it generates. Although they are more massive, they don’t live as long as the cooler stars because they burn their fuel substantially faster.
The Luminosity Classes
In the HR diagram, we can see patterns of luminosity classes. They are:
- Ia for bright supergiants
- Ib for dimmer supergiants
- II for bright giants
- III for giants
- IV for sub-giants
- V for main-sequence stars
- sd for subdwarfs
- D for white dwarfs
In general, type Ia stars are the brightest, while the white dwarfs are the dimmest.
What affects the luminosity class that the star falls in? The star’s age and mass do so. For instance, if the object is a low-mass star whose nuclear fusion has already ceased to continue, it is a white dwarf. If the object is a high-mass star whose life is ending, it is a supergiant. If the star is fusing hydrogen into helium, it is a main-sequence star.
The Evolution of a Star in the HR Diagram
Well, there are dedicated trajectories on the HR diagram that a star goes through when the star goes through its main-sequence all the way to death.
For low-mass stars, they will first go through the main sequence when fusing hydrogen. After that, it becomes a red giant. The star is moving from left to right and down to up on the HR diagram since the temperature of the star decreases as it enlarges, but its luminosity increases. After that, the star is in the asymptotic giant branch, in which its shell of helium and hydrogen is fusing, but its core is not.
Finally, when all its fuel has run out, the star’s core is exposed as a white dwarf, which is on the lower-left corner of the HR diagram because it is hot but extremely dim.
For high-mass stars, when they enter the giant phase, they will essentially enlarge and shrink. If an element in the core has run out, the outer layers collapse until the pressure becomes sufficient for the star to fuse a heavier element. This happens until the star completely runs out of materials for nuclear fusion, after which the core collapses into a black hole or a neutron star, both of which are not in the HR diagram.
Conclusion
In this article, we’ve talked about the structure of the HR diagram. The x-axis represents the spectral type, while the y-axis is related to the luminosity of the star. Remember that a key piece of learning about a star is locating it in the HR diagram. For more information, please visit the webpages in the references below.
References and Credits
- (n.d.). A note on the spectral atlas and spectral classification. Retrieved August 3, 2021, from https://lweb.cfa.harvard.edu/~pberlind/atlas/htmls/note.html
- (n.d.). Stellar Spectral Types. Retrieved August 3, 2021, from http://hyperphysics.phy-astr.gsu.edu/hbase/Starlog/staspe.html
- Australia Telescope National Facility. (n.d.). Post-Main Sequence Stars. Retrieved August 4, 2021, from https://www.atnf.csiro.au/outreach/education/senior/astrophysics/stellarevolution_postmain.html
- (n.d.). Lecture 17: Evolution of Low Mass Stars. Retrieved August 4, 2021, from https://sites.ualberta.ca/~pogosyan/teaching/ASTRO_122/lect17/lecture17.html